See the R code for this experiment
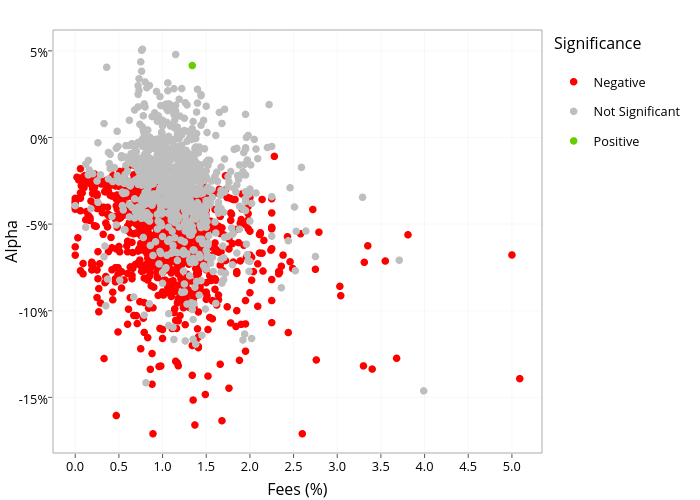
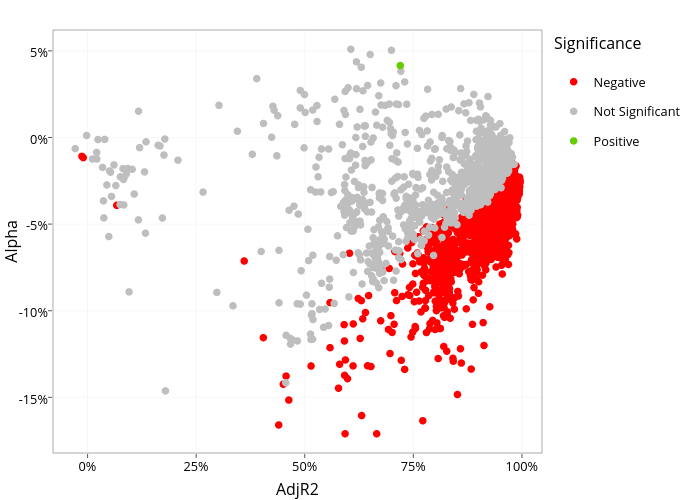
I examined 2,218 mutual funds that Morningstar classified as equity funds domiciled in the U.S. with an inception date of Jan 2006 or earlier. Only one of these funds has significantly positive alpha, the other 2,217 either have insignificant alpha or significantly negative alpha. That’s over 2,000 managers who are delivering returns that are either not significantly different than zero or negative after adjusting for the risks they’re taking. Check out this chart, showing negative, insignificant (from zero), and positive alphas and adjusted R-squareds of a RMRF, SMB, HML, MOM model for 2,218 U.S. equity mutual funds, click through to get an interactive chart to see each ticker.
The next two paragraphs are a primer on alpha for the average investor, quants – feel free to skip ahead to continue with the study.
Let’s address two questions the average investor will have before delving into the details: 1) What the hell is alpha? and 2) Why should I care?
We’ll address part 2 first: You should care because mutual fund managers charge you fees for their investment management acumen. If your manager doesn’t have any investment skill then you shouldn’t pay him fees. Which is to say you should use a low fee index fund instead.
Now for the trickier part: What the hell is alpha? Part of my brain thinks alpha and beta are Greek letters masquerading as logic, but another part realizes there’s some important concepts represented here. Let’s start with the topic of risk-adjusted returns. If we compare our fund’s returns with the overall market’s returns over time we can pick up a key trend of our fund’s sensitivity to market movements. If our fund has a sensitivity of 1.1 to the market we expect our fund to be up 11% when the market is up 10% and conversely to be down 11% when the market is down 10% [ 10% * 1.1 = 11%]. In technical terms our fund’s sensitivity to the market is referred to as beta and is the slope coefficient from a univariate regression between our fund and the market. If our fund is up more than the market after adjusting for it’s sensitivity or beta, say a fund with a beta of 1.1 is up 12% when the market is only up 10%, we can say our fund has positive risk-adjusted returns. In this case the risk adjustment is 11%: the 10% market return multiplied by our fund’s market beta of 1.1, and our fund’s return is 12%, so the risk-adjusted return is positive: 12% – 11% = 1%. The left over 1% in this case is presumably created by the manager’s investment skill that can’t be explained by the overall market movements. Alpha is a similar concept to risk-adjusted returns, but we need to consider the risk free rate that cash or say a 90 day t-bill would earn. The difference between our fund’s or the market’s return over cash is referred to as risk premium and can be considered compensation for the additional risk of investing in stocks instead of cash. Alpha is the difference between our fund’s risk premium and the market’s risk premium adjusted for our fund’s sensitivity to the market. To make the math simple, assume the return on cash is 1% (ha!) and our fund has a 12% return, a sensitivity or beta to the market of 1.1, and the market return is 10%. The fund has a risk premium of 12% – 1% = 11% and the market’s risk premium adjusted for our fund’s sensitivity is (10% – 1%) * 1.1 = 9.9%. The alpha is the difference between the two: 11% – 9.9% = 1.1%. In this case, where the only risk factor we need to consider is the market, our manager delivered 1.1% of returns that we can’t explain with overall market movements and we’ll conclude this 1.1% of explainable returns is skill and say she delivered alpha. However, before we commend our manager too much, we want to consider some other basic risks she might be taking.
This study uses 4 factors to explain fund returns: market risk premium, size, style, and momentum. All 4 factors are sourced from Kenneth French’s data library. Size is the return of small companies less large companies to capture the portion of funds’ returns that can be attributed to the size of the companies they are investing in. Similarly, style is value (high book value relative to market value) less growth (low book value relative to market value) to capture the portion of funds’ returns that can be attributed to the style (value vs growth) of the stocks they buy. Finally, momentum is the returns of recent winners less the return of recent losers to capture the portion of funds’ returns that can be attributed to picking stocks with high returns in the recent past. Details on market risk premium, size, and style can be found here and details for momentum can be found here.
The universe of funds are sourced from a Morningstar search for open-end mutual funds that invest in equity and are domiciled in the United States. The search was further refined for funds that were in operation at least as far back as January 2006 to allow for a common time period of study of monthly returns from January 2006 to August 2016. This search did not include funds that went out of business, which causes concerns about survivorship bias, or the bias from excluding the poor returns of funds that went bust. However, since I’m taking the other side of the bet, that equity mutual funds don’t produce alpha, I’ll allow the survivorship bias and still show that this universe of funds lacks positive risk-adjusted returns. The returns were sourced from the Yahoo finance database which are reported net of fees and are total returns which assume reinvestment of dividends.
Let’s take another look at the annualized alphas and adjusted R-squares.
1st Q.: 0.807
Median : 0.905
Mean : 0.846
3rd Q.: 0.947
Max. : 0.995