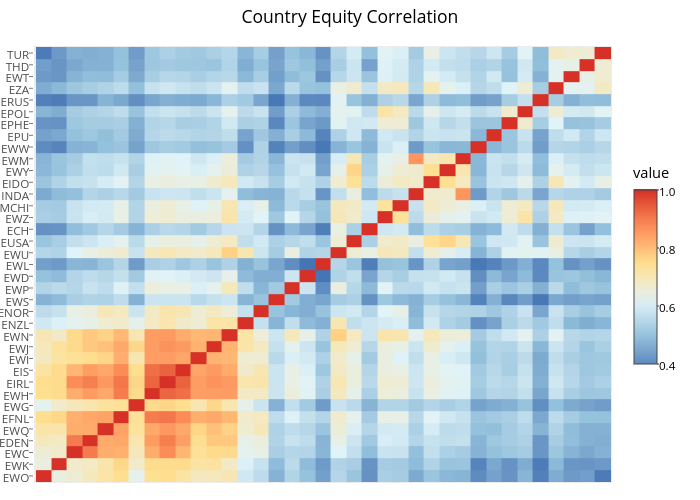
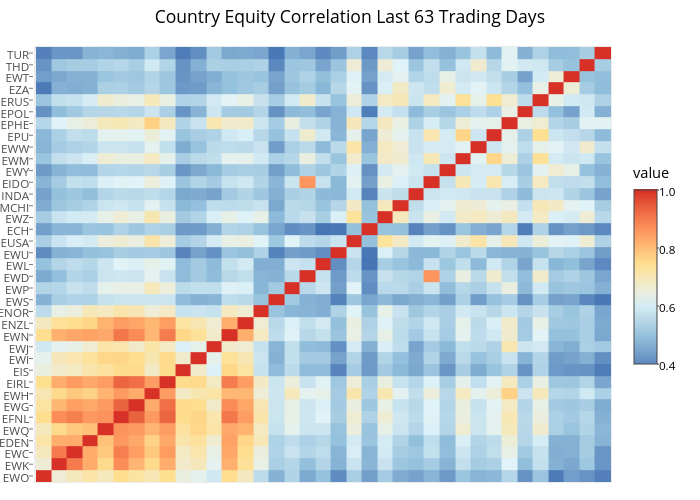
Now that the 7% two day downturn of global equities as an initial reaction to Brexit is roughly three months in the rear view we can examine the risk signs the market flashed during the event and where we are today. The two risk signals we’ll examine are the absorption ratio and turbulence. The absorption ratio is sourced from Principal Components as a Measure of Systemic Risk and turbulence is sourced from Skulls, Financial Turbulence, and Risk Management. The absorption ratio is a measure of market fragility – a high ratio indicates assets are moving in one direction, while a lower ratio indicates the system of assets is more diversified. Turbulence is similar to volatility, a high ratio indicates an outlier or extreme event in the system of assets measured. To examine the global equity market I am using 37 country ETFs to build the system of assets, see the link at the top of this post for the gory details.
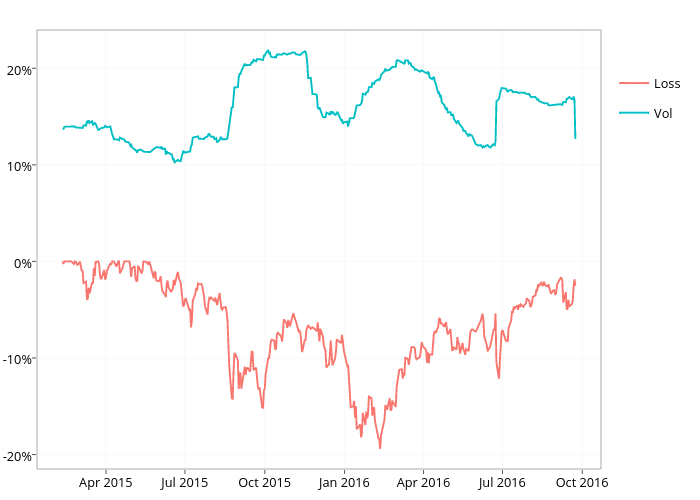
The rolling z-score of the absorption ratio (AR) and turbulence (Turb) are graphed below, along with the drawdowns and rolling volatility of the global equities (iShares MSCI ACWI ETF) over the same time period.
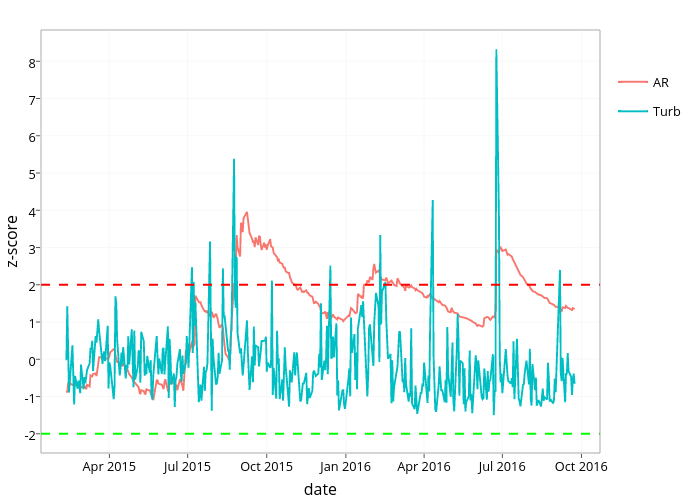
 Global equities have been in a drawdown since May 2015. During this period we’ve seen the absorption ratio z-score exceed 2 three times indicating the market has been dangerously fragile over the trailing 12 months. Turbulence contemporaneously spiked with each fragility z-score of 2 preceding deeper losses in the current drawdown since the May 2015 peak. Each fragility and turbulence spike above 2 were followed by periods where both measures receded, hence global equity losses have not been too extreme. However, the increased frequency of the rolling fragility z-score exceeding 2 is not a good sign going forward for the diversification protection of different countries.